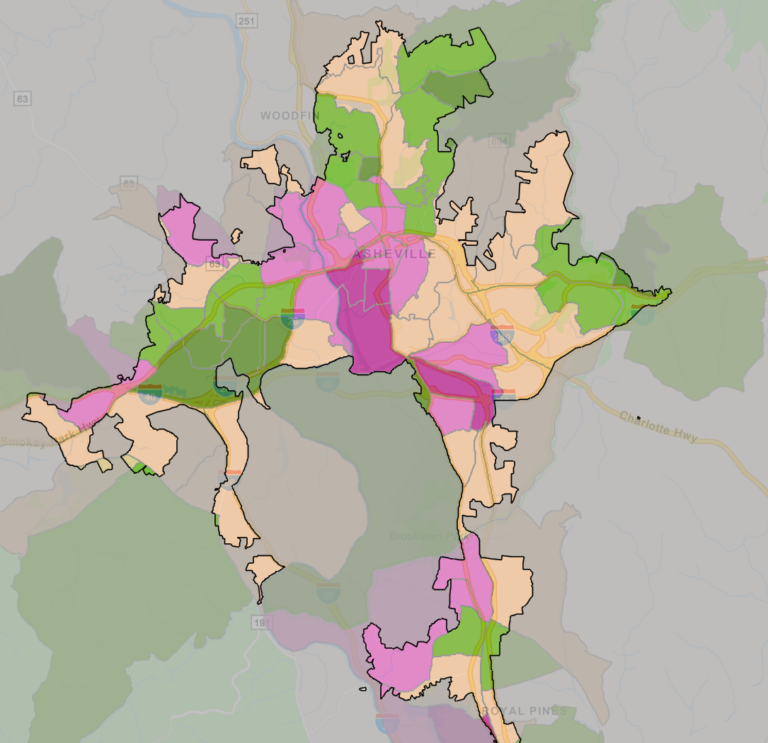
The City of Asheville has launched an updated version of its Community Climate Vulnerability map, improving accessibility, streamlining data, and linking directly to resources and solutions in the Climate Action Toolkit.
The map is designed to help both residents and City staff plan and prepare, by understanding the challenges we face. It creates an index score that combines climate and social indicators including flooding, landslide and wildfire, heat vulnerability, and Center for Disease Control (CDC) social vulnerability.
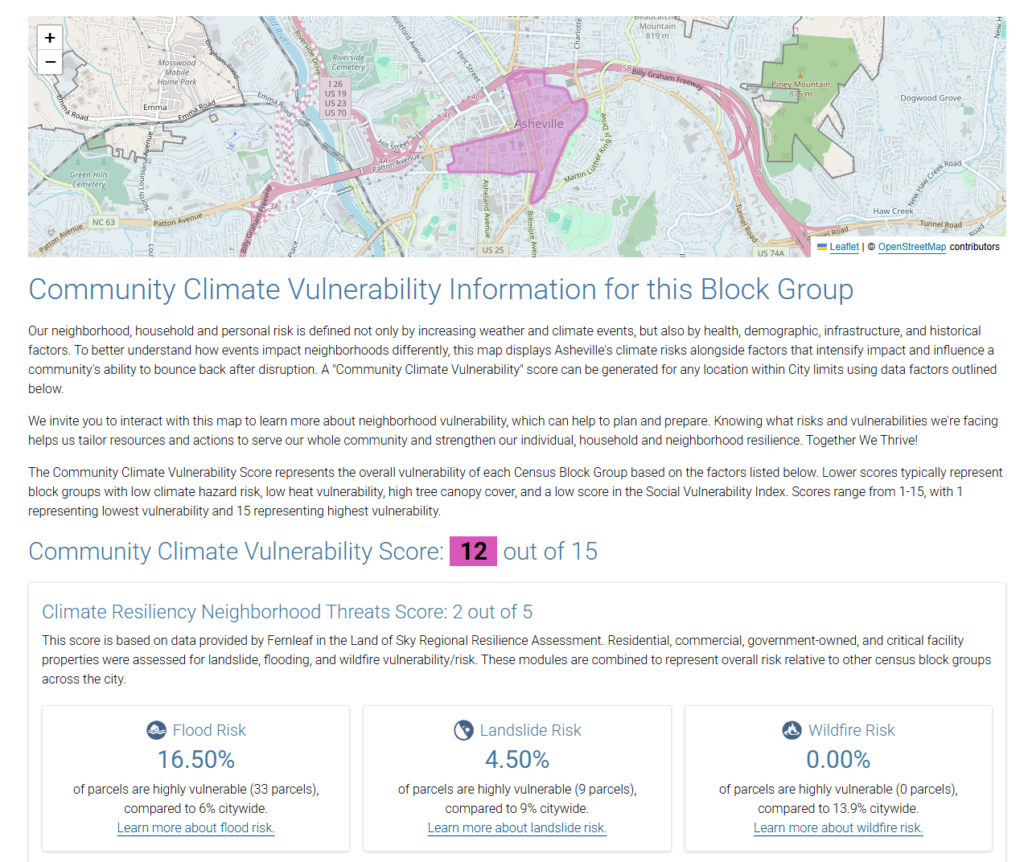
With the update, map users can now easily access related resources to activate household preparedness and build resilience. For example, when a user clicks on an area on the map, they will see a score for the area’s climate threats, with detailed data on flood, wildfire and landslide risk and accompanying links to the toolkit to learn more about those risks and how to handle them.
“Knowing our risks and vulnerabilities helps us tailor resources and actions to serve our community and strengthen our individual, household and neighborhood resilience,” said Kiera Bulan, Resilience Division Manager within the City’s Office of Recovery and Resilience. “Strengthening the connection between map data and the toolkit of solutions can help the community convert information into action.”
Part of SimpliCity
The map is integrated into the City’s SimpliCity tools, which include key Capital Projects, zoning and permitting information, crime and development dashboards, sanitation schedules, and more. From the SimpliCity homepage, you can search any City address and get several kinds of data, including a “Climate Threats and Vulnerability” page which displays climate vulnerability score, details on threats and toolkit links to learn more. Here’s an example of that data, using City Hall’s address.
The new map has also updated data sources to assure that information is current and accurate, and integrated with the Land of Sky Regional Resilience Assessment data for ongoing updates. The update also improves digital accessibility to be compatible with the latest requirements.
The map was originally developed as part of the City’s Climate Resilience Initiative and a commitment to data-informed decision making, following the January 2020 resolution declaring a Climate Emergency. Foundational climate risk data and insights from the Climate Resilience Assessment, alongside non-climate related vulnerability data, were used to build the map.